Does the crypto market break Bullisch now?

Crypto market forecast for Wednesday, July 9, 2025: The market could possibly break the series at lower high points to target the ATH.
A few days ago, the market was able to bounce into the 50-dayema at around $ 3.23 trillion and have increased sharply since then. But will the course be able to break the resistance?
The crypto market draws a series at lower high points
After the market on the Golden Ratio resisted at around USD 3.3 trillion, it was then corrected for the 0.382 FIB Support on the 50-dayema at around 3.2 trillion.
There the course was able to bounce bullly in order to then break the Golden Ratio at around $ 3.3 trillion. So far, however, the course has shaped a deeper high point, which remains the Bärische trend line intact.
If the market breaks out bullishly and overcome the trend line, the next significant resistances are waiting at around $ 3.44 trillion and 3.5 trillion.
The next significant fibonacci supports are still waiting downwards at around $ 3.22 trillion and USD 3.10 trillion. Apart from that, the indicators are rather bullish in the daily type.
The MACD lines are crossed and the EMAs have a golden crossover, which makes the trend be bullish in the short to medium term. The RSI, on the other hand, shows itself neutral and the histogram of the MacD today ticks very deeper.
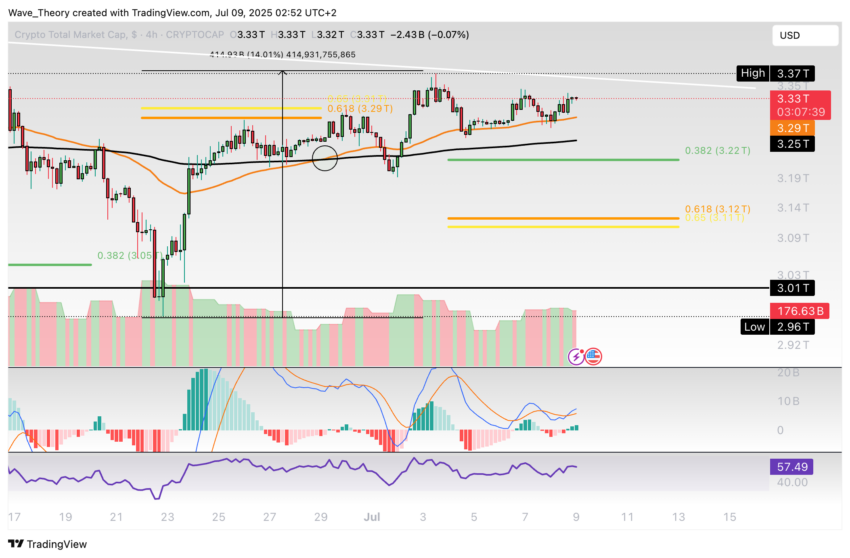
There is a bullish trend confirmation in the 4h chart
In the 4h chart, the EMAs shaped a golden crossover again, which makes the trend confirmed bullish at short notice. In addition, the histogram of the MACD is currently ticking bullly higher and the MacD lines are crossed bullish.
Meanwhile, the RSI moves in a neutral area and does not give Bullische or Bärische Signals. Overall, the crypto market was able to rise around 14 % since it reached a local low at around $ 2.96 trillion.
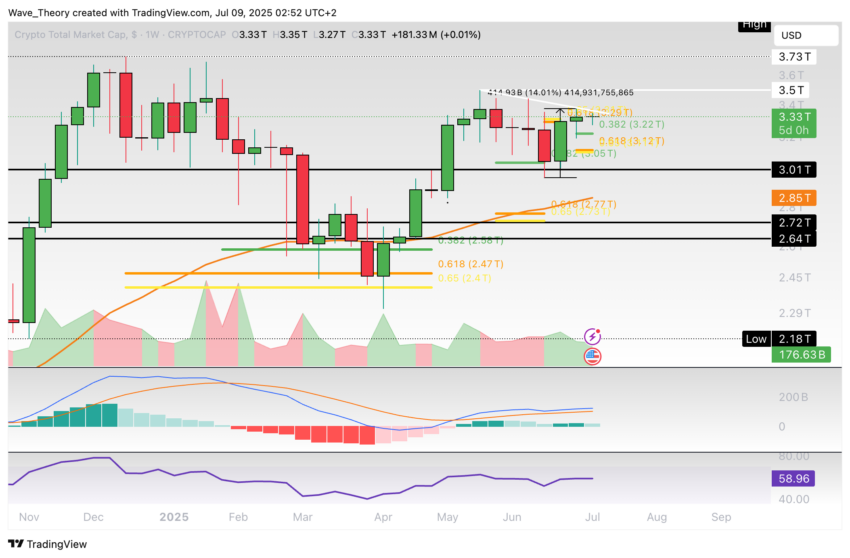
The indicators give mixed signals in the weekly chart
In the weekly chart, the MacD lines are still crossed Bullisch, whereas the histogram of the MacD begins to tick more deeply this week. The RSI does not give bullish or bear signals.
If the course breaks the next resistances, it could return to the ATH at around $ 3.73 trillion. Downwards, at the latest around 2.75 trillion USD, significant FIB supports support.
In addition, the 50-week AMA acts as additional support at around $ 2.85 trillion.
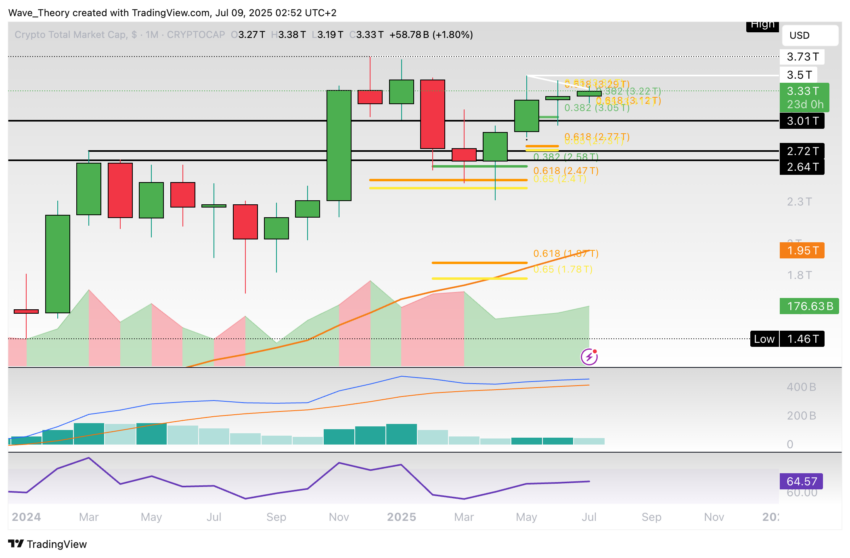
The crypto market is also undecided in the month
The indicators also give ambiguous signals in the moon. The MACD lines are still crossed in bully, whereas the histogram of the MacD has so far been more deeply ticking this month.
In the meantime, the RSI continues to move in a neutral area.
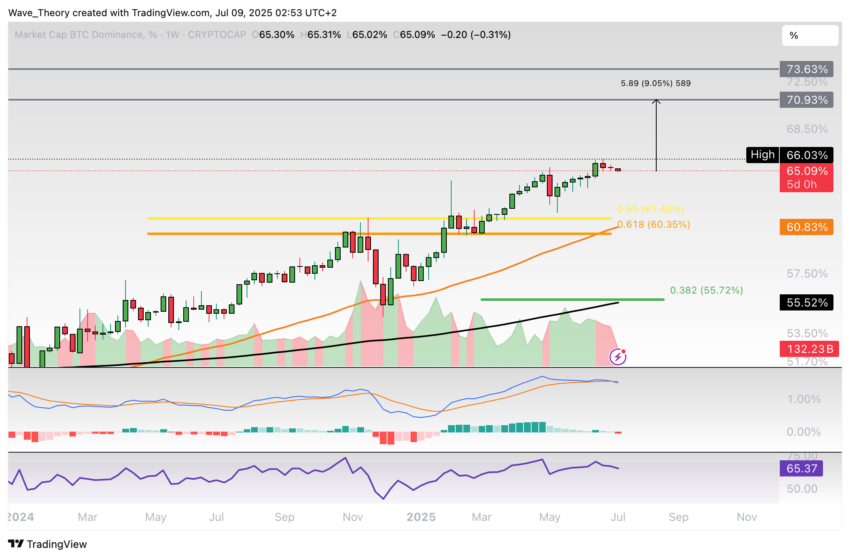
The Bitcoin dominance could increase by another 9 %
The Bitcoin dominance remains bullish. There is now around 9 % upward potential until the course for significant resistance areas bumps between around 71 % and 74 %.
Downwards, the BTC dominance can be found at around 60.5 % of significant support at the latest at the Golden Ratio level. There, the 50-week AMA also acts as an additional support.
Otherwise, the next significant support is waiting for around 55.5 % on the 200-week-up level at the 0.382 FIB level. Apart from that, the EMAs have a golden crossover in the weekly chart, which means that the trend remains bullish in the medium term.
The MacD lines, on the other hand, have now crossed Bärisch and the histogram of the MacD has been berrying deeper for three weeks. In the meantime, the RSI borders on overbought regions, but is currently returning to a neutral area.
On this Crypto exchanges Can you act cryptocurrencies:
Here If it goes to the last crypto market course forecast from July 2, 2025.
Disclaimer
In accordance with the guidelines of the Trust project, this price analysis article only serves for information purposes and should not be regarded as financial or investment advice. BeinCrypto commits to precise, impartial reporting, but the market conditions can change without prior notice. Always carry out your own research and consult a specialist before making financial decisions. In addition, the past performance does not offer any guarantee for future results.