Is the cycle top there and how do you recognize it?

According to a current analysis by the crypto analysis company Alphractal, Bitcoin may not yet reach its climax in the current market cycle.
The company refers to its repetition fractal cycle model- a metric that has determined the maximum and lows of Bitcoin with remarkable precision since 2015.
The Alphractal analysts argue that the current market, based on this fractal pattern, still offers space for an upward movement. “Will it be repeated this time? Nobody knows with certainty,” said the company, “but there is a high probability.” It is expected that the next few months will be decisive to test the reliability of this repeating fractal structure, which has become one of the most mentioned instruments of the company for the assessment of long -term trends.
Mine stocks and momentum: an important signal?
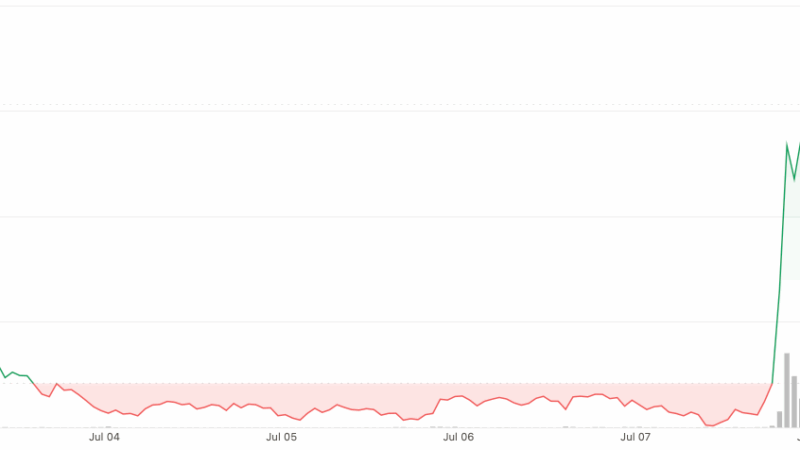
Another knowledge von Alphractal refers to the mining sector, which is often seen as the main driver of Bitcoin course behavior. The company points out that mining stocks, especially Iris Energy (Irish), are now increasing faster than Bitcoin itself. Irish market capitalization has increased from $ 1.2 billion to over $ 4 billion, which signals another interest of investors in the Bitcoin infrastructure layer.
However, Alphractal also determines a weaker correlation between mining shares and BTC, which indicates increased volatility. Since mining companies usually keep significant Bitcoin reserves on both the chain and institutional vehicles, any strategic movement of these companies could significantly influence the market direction of BTC. The company advises to carefully observe the miners' activities as an indicator of the general market mood.
How to recognize a Bitcoin cycle top: Findings of experts
Recognizing the climax of a Bitcoin cycle remains a complex task, but several indicators have proven useful in the past. According to Glassnode and other leading on-chain data providers, one of the most reliable signals from the MVRV Z-Score (Market Value to Realized Value) is. This key figure indicates when Bitcoin is significantly overrated in relation to its realized price. In the past, MVRV values over 7 have compared themselves with large market highs.
Another important key figure is the PI Cycle Top Indicator, which was developed by Philip Swift. This model compares the sliding 111-day average with a 2-fold of the sliding 350-day average. In the past, the overlaps fell together with the highs of BTC within a few days.
And finally, stock exchange inflows of long -term owners are often a red cloth. When dormant coins begin to go to the stock exchanges, this can indicate profit -taking that typically near cycle high stalls can be observed.
The combination of these data -controlled tools with macrotrends and the behavior of the miners can provide a more complete image of the cyclical turning points of Bitcoin.